RL · 2026-09-25
Why Generation and Training Probabilities Differ
Explore how to reduce differences caused by computation order, then use probability ratios to account for remaining engine and model-version differences.
The preceding articles explored how TITO and R3 preserve tokens and expert choices, and how to align quantization settings. Yet even with identical inputs, weights, and precision, the two engines can compute different token probabilities.
In this article, we will first reduce differences caused by computation order, then account for remaining differences by correcting how much each sample contributes to learning. We will distinguish differences caused by computing with the same weights differently from those caused by updating the weights, then examine how probability-ratio correction adjusts learning contributions.
The Same Numbers Can Give Different Results
The inference engine generates tokens one at a time, while the training engine rereads multiple recorded tokens together to recompute their probabilities. Because the shapes of the data being processed differ, the kernels used for matrix multiplication or attention, and the order of summation, can differ too. Computers cannot retain every decimal digit, so these differences can affect the result.
Consider a tiny example. We add 1.0, 0.04, and 0.04, rounding to one decimal place after each addition. This is an artificial rule that illustrates intermediate rounding, not a reproduction of an actual GPU number format.
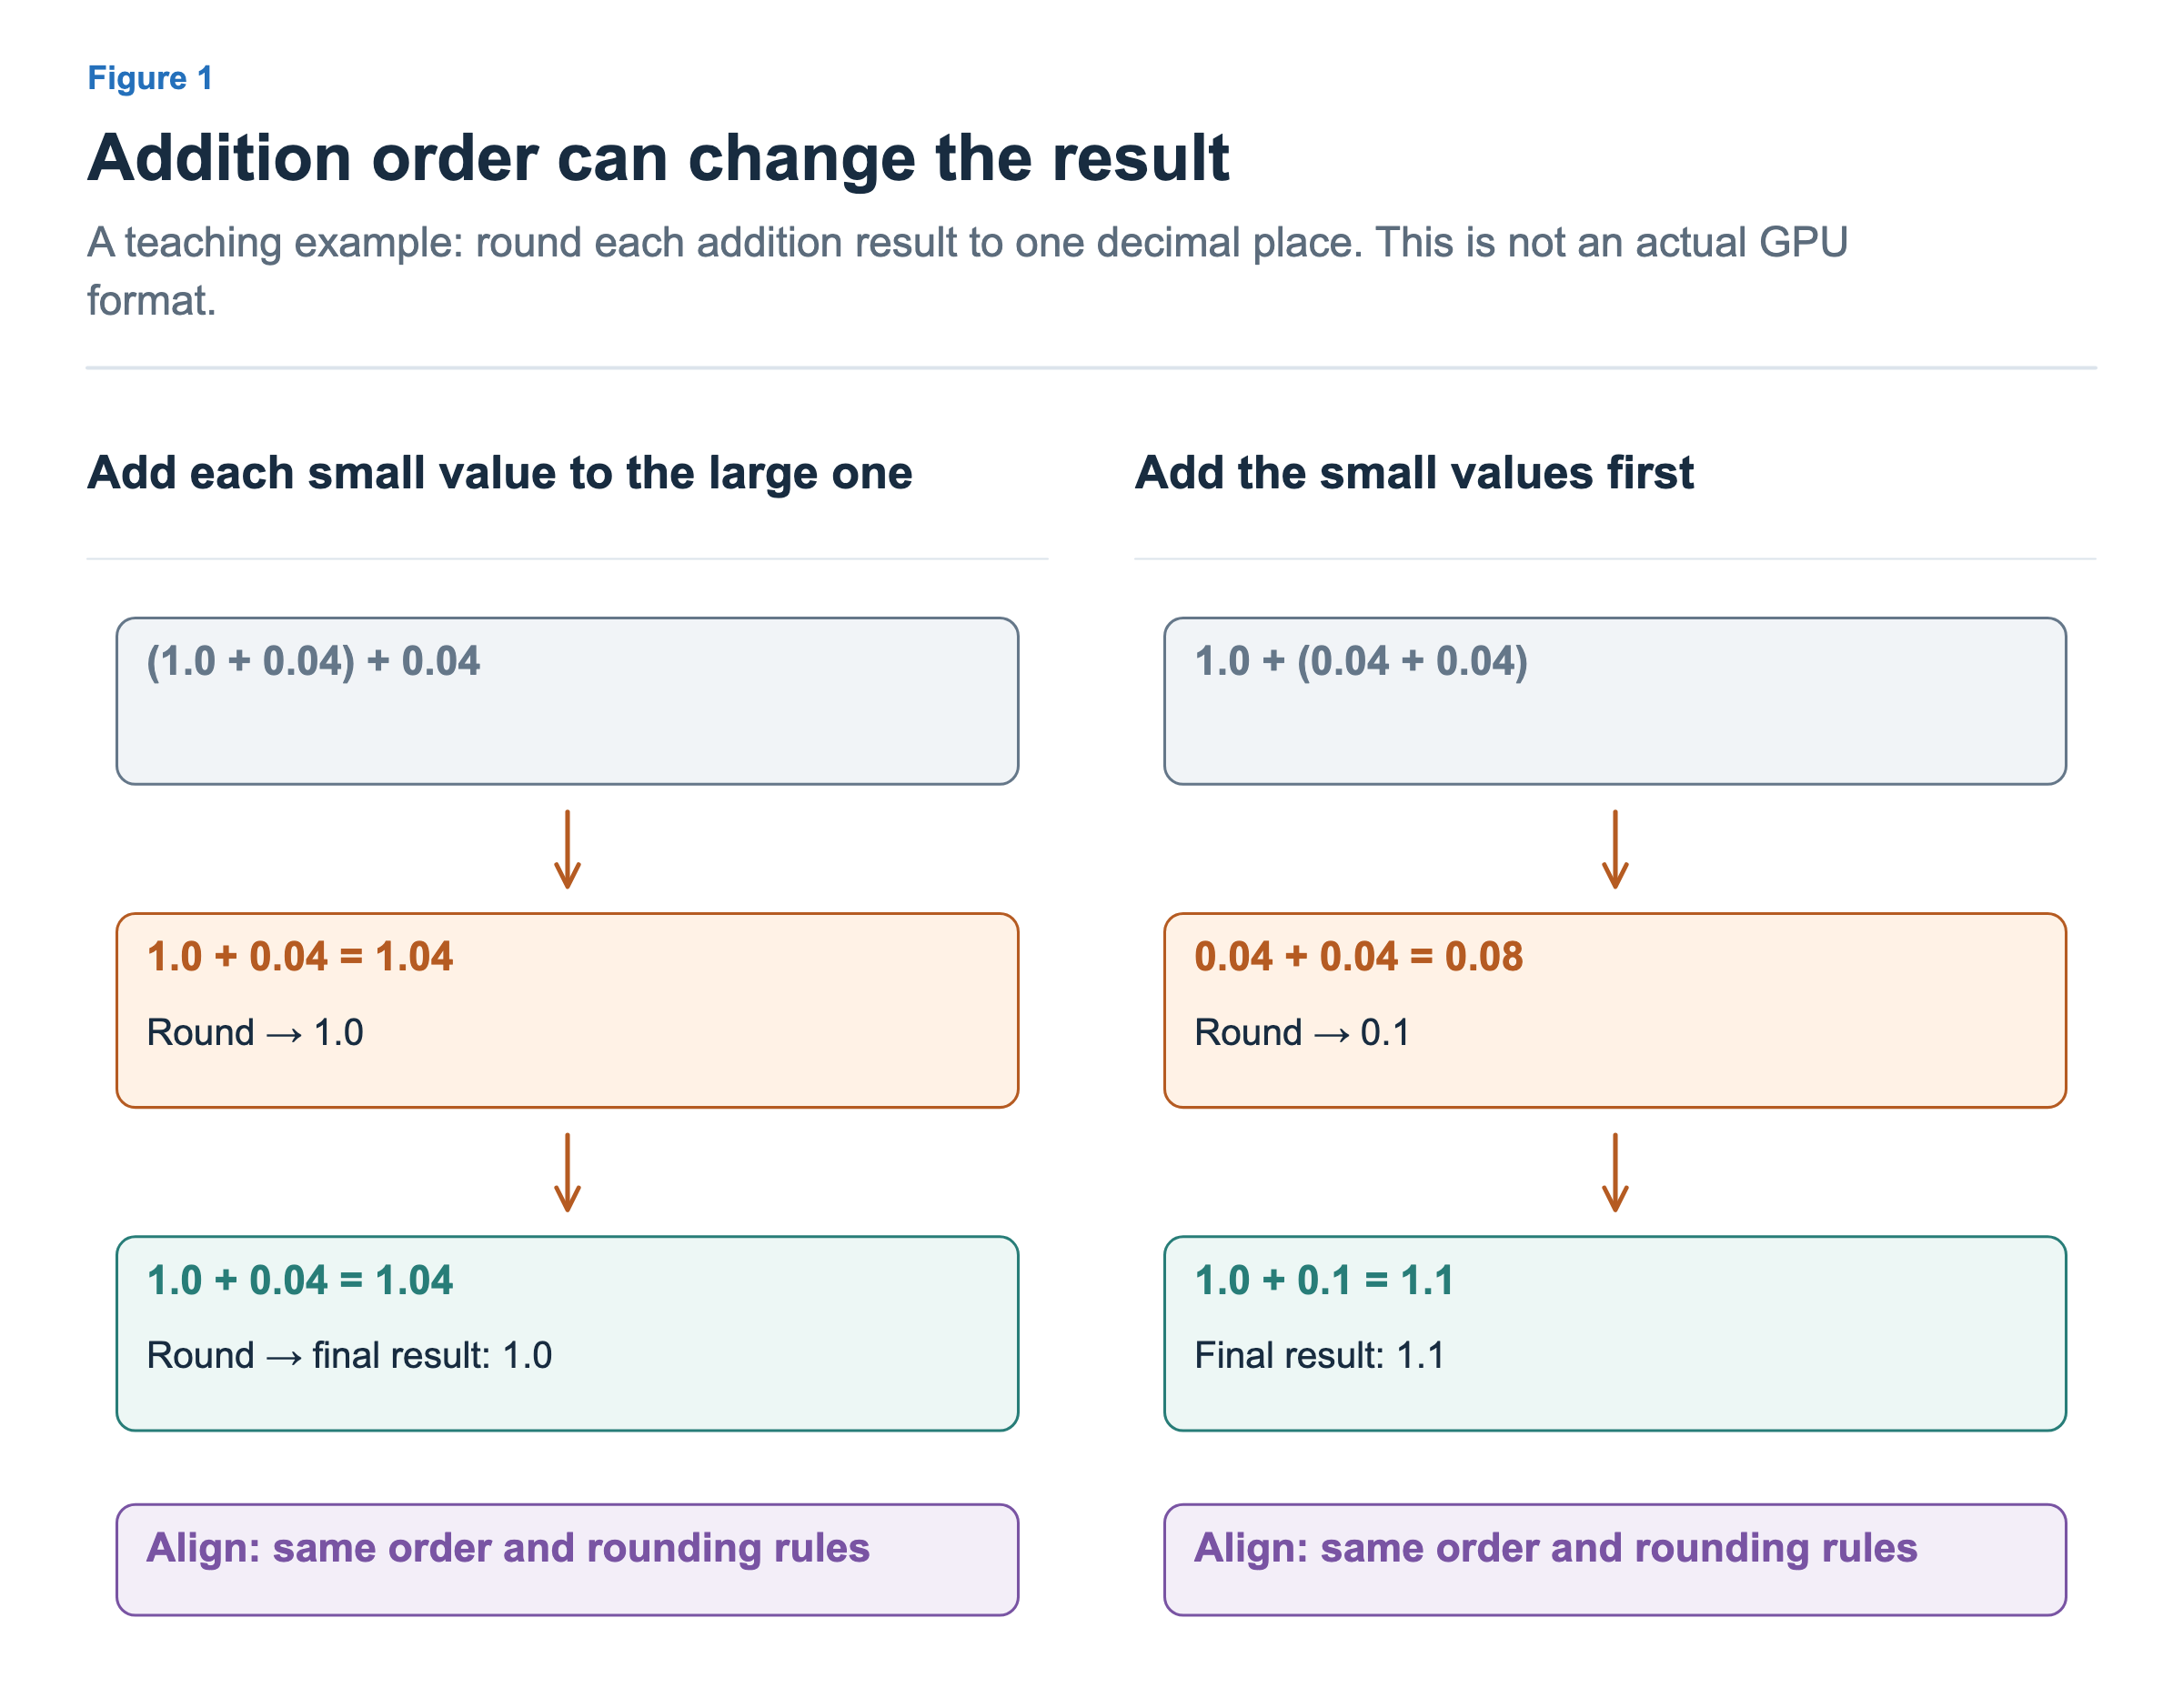
On the left, adding 0.04 to 1.0 gives 1.04, which rounds back to 1.0. The same thing happens on the next addition, leaving a final result of 1.0. On the right, adding the small numbers first gives 0.08, which rounds to 0.1. Adding 1.0 then gives 1.1. The underlying mathematical expression is the same, but which intermediate result gets rounded first differs.
In an LLM, the order in which many values are summed, the way operations are fused, and kernel selection based on batch shape can also introduce numerical differences. Through subsequent computations, those differences can affect output scores, or logits, and token probabilities. Miles v0.1 §5.3
Align the Computations You Can
To match the two results in figure 1, we can use the same summation order and rounding rules. The same principle applies when aligning computations between engines. The true-on-policy alignment mode described by Miles performs this alignment more strictly.
Three aspects are useful to understand intuitively.
- Execute the same operations in the same way. Align attention kernels and the implementations of other operations. If a fused implementation used for speed introduces differences, that optimization may be disabled.
- Prevent other requests in the batch from changing the result. Generation and training batches cannot always be identical, so batch-invariant operations preserve the result for a given input even when the batch shape changes.
- Reevaluate completed records using similar computation shapes. Miles rereads each completed sequence in a prefill pass to compute log-probabilities. Instead of simply comparing values obtained during token-by-token generation, it aligns the form of computation used for scoring.
This does not make matching easy for every model and configuration. The Miles v0.1 paper reports zero difference in reevaluated log-probabilities for sampled tokens under supported configurations, while distinguishing this from a guarantee covering every probability in the vocabulary. The documented model coverage is also limited to dense Qwen3 0.6B and 4B. In the Qwen3-4B experiment, the reward curve was similar to the baseline, while rollout took longer. Exact alignment comes with coverage limits and a throughput cost. Miles v0.1 §5.3
We should therefore align the conditions we can, while recognizing that practical systems also need ways to handle remaining differences. Moreover, even with aligned computation, probabilities change when the weight version changes.
Engine Differences and Model-Version Differences
Let us compare the probability of the same next token x, given the same prompt P and preceding tokens. Assume that sampling conditions such as temperature and candidate restrictions also match. The numbers below are illustrative examples for distinguishing the causes.
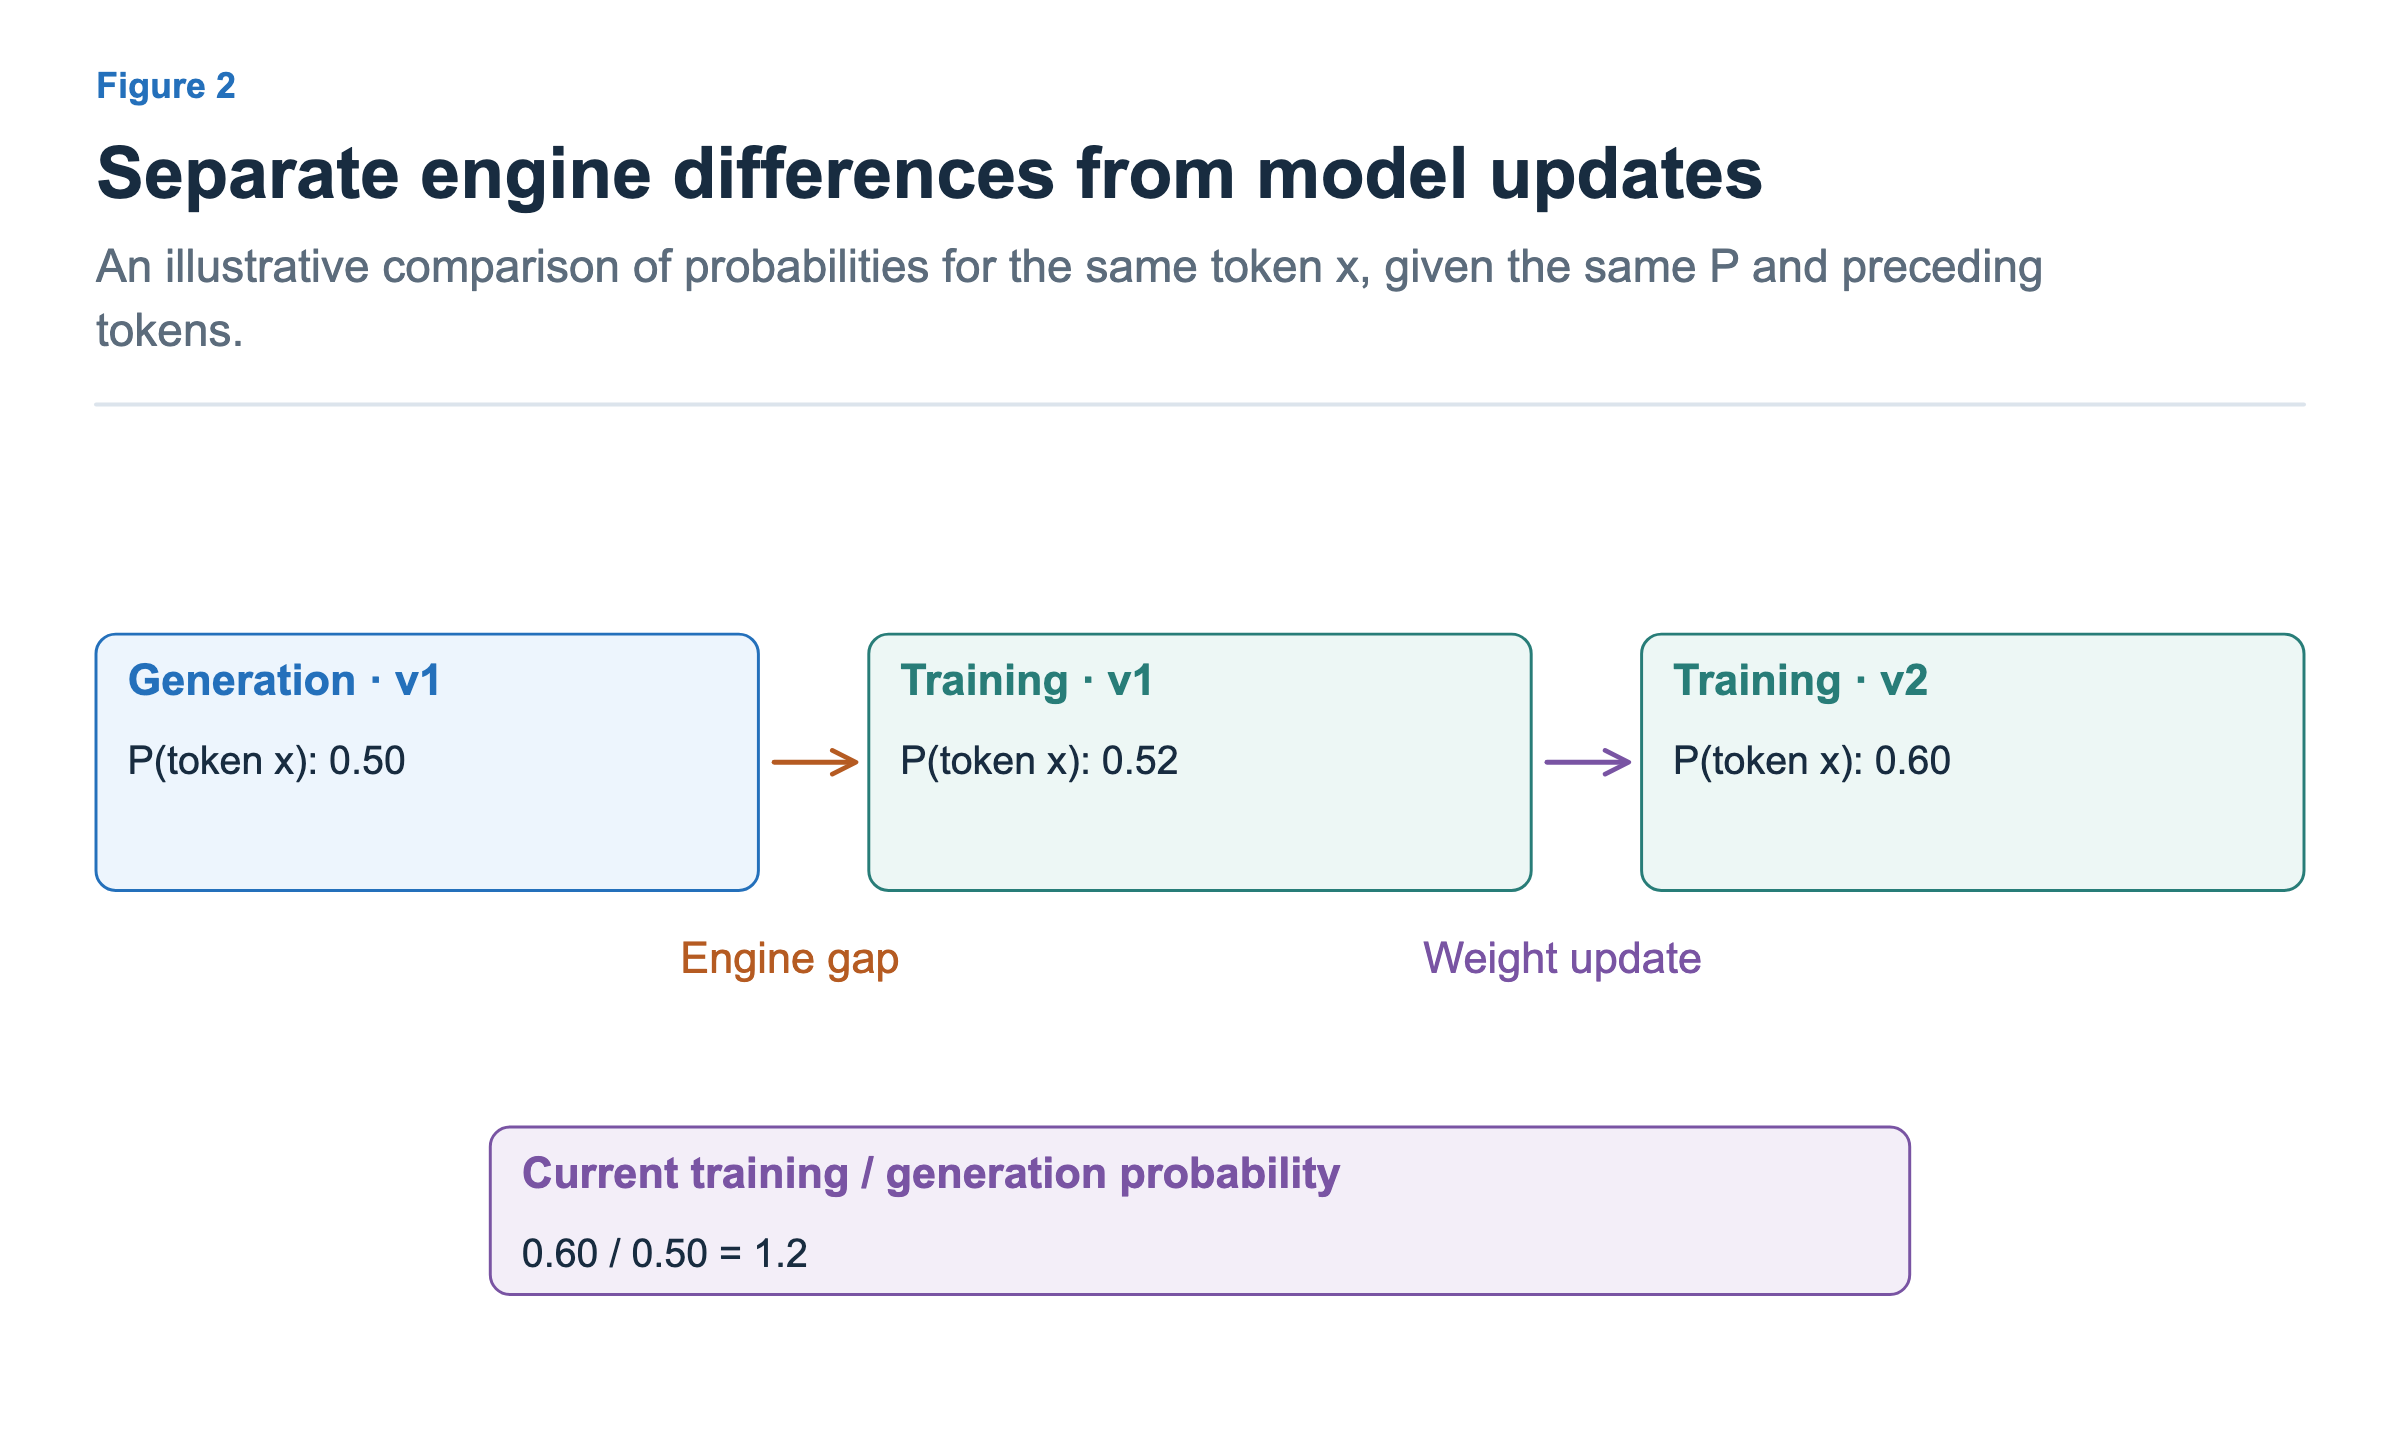
The generation engine assigns probability 0.50 with v1, but running the same v1 weights in the training engine gives 0.52. This is a difference in engine computation. After training produces v2, the probability changes to 0.60 even within the same training engine. This is the effect of updated model weights. It does not mean that every token’s probability increases this way.
Dividing the current training probability of 0.60 by the generation-time probability of 0.50 gives 1.2. This comparison includes both differences. Even if perfect computation alignment removes the first difference, the difference between data generated with old weights and the current model remains. The mismatch between inference and training is sometimes called TIM (train–inference mismatch), but separating these two cases helps us understand its causes.
We also need to check what was recorded as a probability. The probability actually used to sample a token is not automatically the same as the model probability before candidate restriction, or a probability reevaluated after generation. To explain importance correction below, we will call the actual generation probability q and the training-side comparison probability p.
Correcting Learning Contributions with Probability Ratios
Suppose that, in the same context, a token has probability 0.50 on the generation side and 0.60 on the training side. That token appears less often in the generated data than it would under the training-side distribution. We can understand the ratio 0.60 / 0.50 = 1.2 as a weight that gives more learning contribution to an underrepresented choice. Conversely, a choice that appears more often than under the comparison distribution receives a smaller weight. This is the basic idea of importance sampling (IS).
What we increase or decrease here is not the token’s generation probability itself. We adjust how much weight to give the learning direction determined by the advantage. However, applying large ratios directly can give some tokens an outsized influence on the update.
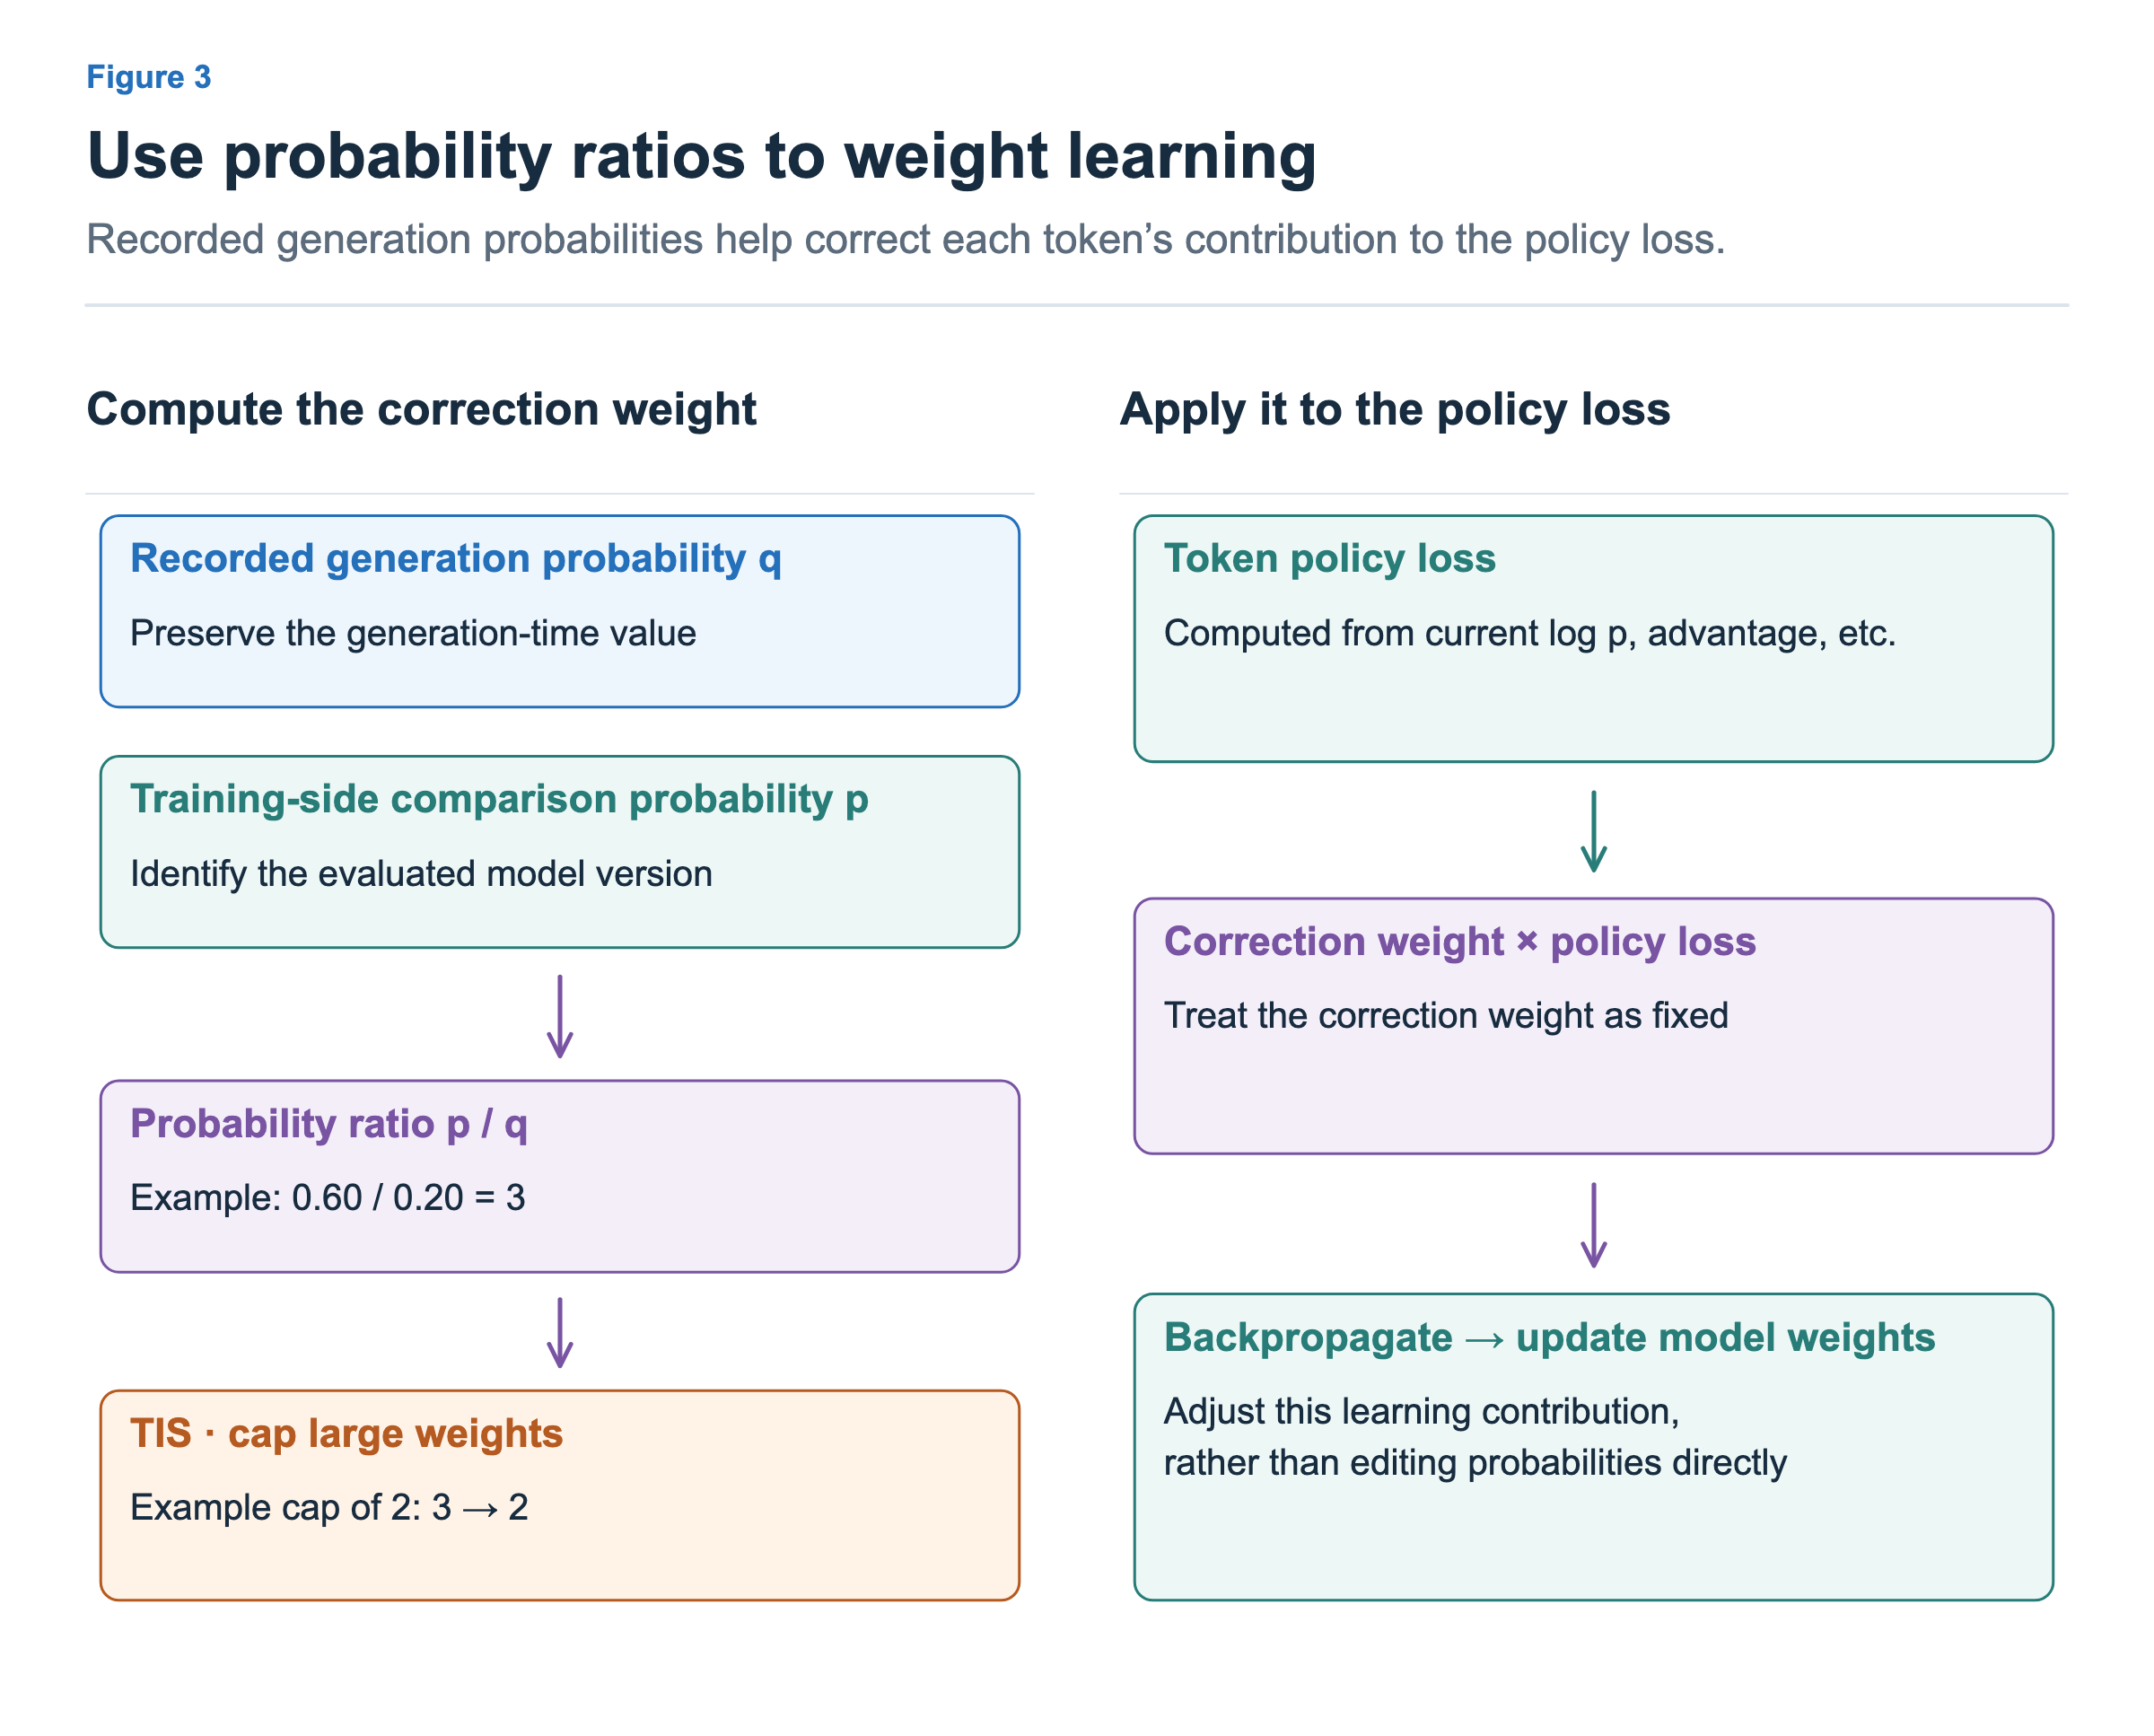
Figure 3 shows a case with a larger ratio. With generation probability 0.20 and comparison probability 0.60, the ratio is 3. TIS (Truncated Importance Sampling) caps this weight: with an upper limit of 2, it uses 2 instead of 3. Limiting large contributions changes the estimate from one using the original ratio directly. Token-level correction also does not mean that differences across the distribution of entire long responses disappear completely.
The TIS path in Miles holds this correction weight fixed and multiplies it into the token policy loss, then backpropagates through that loss. The comparison probability usually comes from a training-side reevaluation before the update; configurations that skip that evaluation use a fixed value from the current forward pass. We should therefore not assume that every implementation simply multiplies in the current-probability ratio from figure 2 one more time. Miles v0.1.0 policy loss, correction implementation
We should also distinguish this from PPO clipping in article 2. PPO considers the sign of the advantage when limiting excessive policy changes in the favorable direction. The TIS operation here caps large values of an additional correction weight. Both operations can appear within the same loss formulation.
Computation alignment reduces the causes of differences between the engines. Probability-ratio correction accounts for remaining differences by adjusting how much the data contributes to learning. The next article will examine how model-version differences grow when generation and training run concurrently, and how to manage stale experience.